Test Results
Analyse test outcomes across jobs, tag tests, and view combined and per-job test trends.
The Test Results page provides deep visibility into test outcomes across all your Jenkins jobs.
Page layout
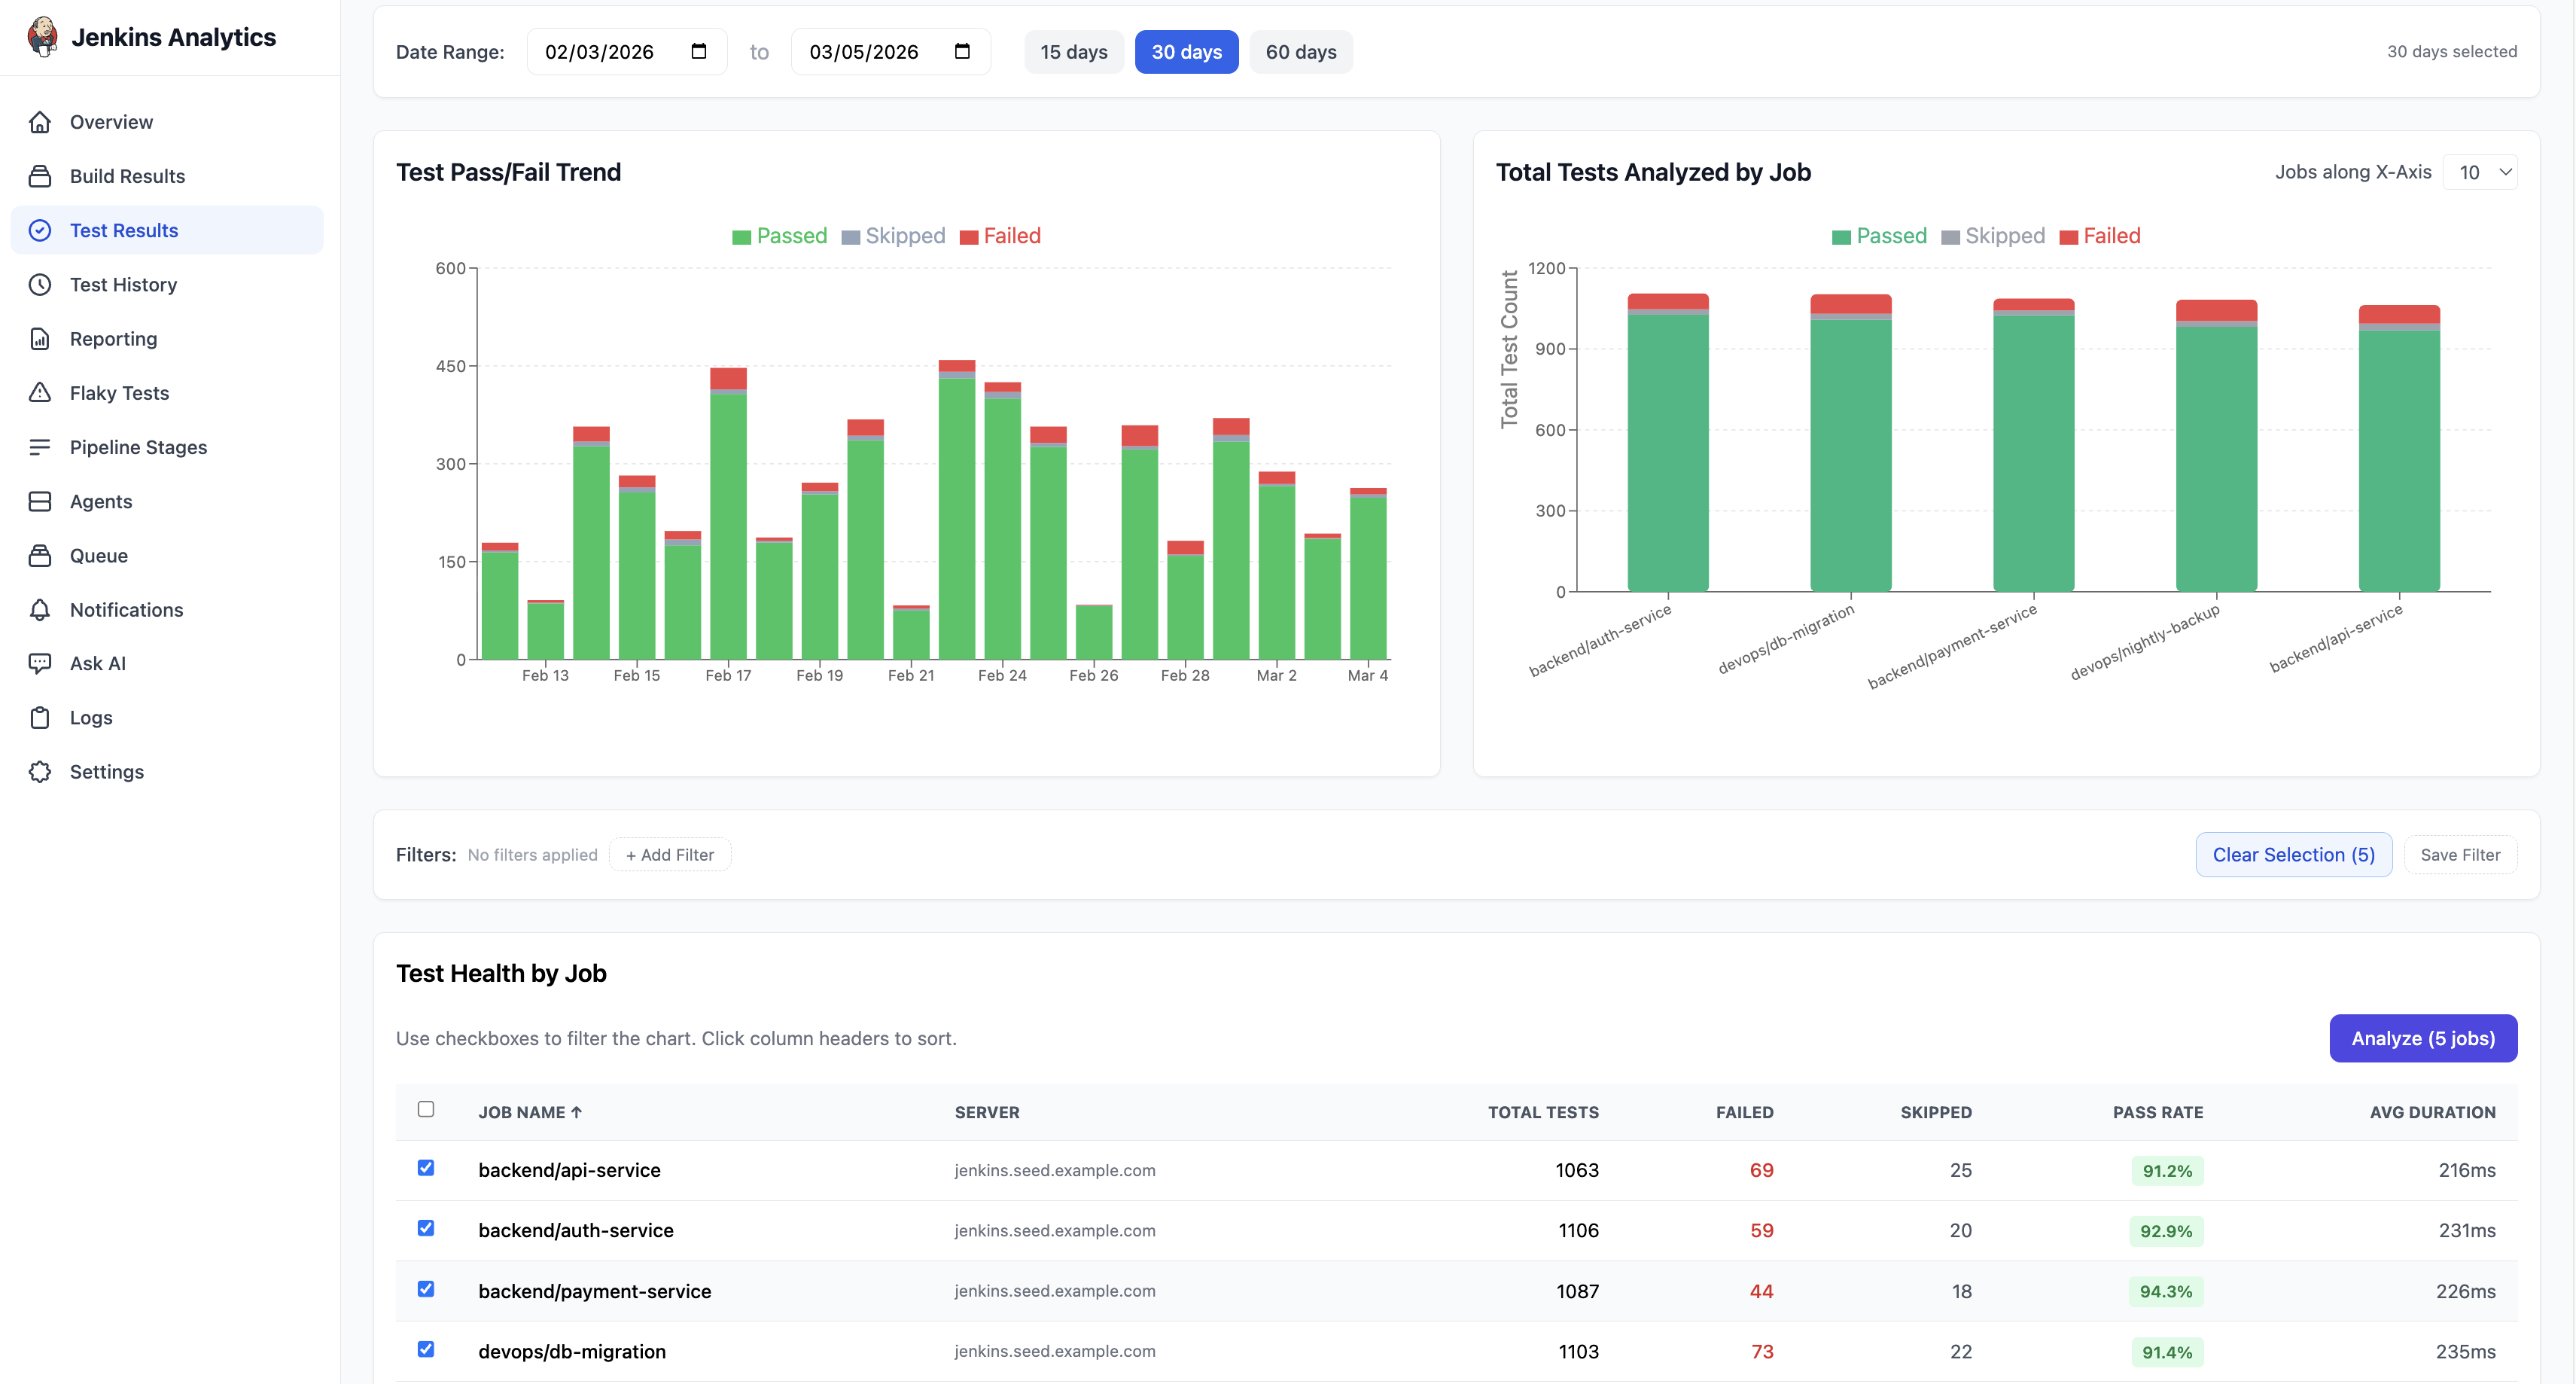
The Test Results page is divided into three sections:
- Charts — Test Pass/Fail trend and Total Tests Analyzed by Job
- Filters — narrow results by job, status, or server
- Test Health by Job — a sortable table of every job with test metrics
Date range
Use the date range controls at the top of the page to set the time window. Quick presets are available for 15 days, 30 days, and 60 days, or pick a custom range using the date pickers.
Test Pass/Fail trend
A stacked area chart showing daily test volume by outcome:
- Green — Passed
- Gray — Skipped
- Red — Failed
This chart makes it easy to spot spikes in test failures or track overall test health over time.
Total Tests Analyzed by Job
A stacked bar chart with one bar per job showing the proportion of Passed, Skipped, and Failed tests. Jobs with high failure counts stand out immediately.
Test Health by Job
The table shows test metrics for each job. Columns include:
| Column | Description |
|---|---|
| Job Name | Jenkins job name |
| Server | The Jenkins instance that ran the job |
| Total Tests | Total number of test executions |
| Failed | Number of failed tests (highlighted in red) |
| Skipped | Number of skipped tests |
| Pass Rate | Overall pass rate percentage |
| Avg Duration | Average test execution time |
All columns are sortable. Use the checkboxes to select jobs for deeper analysis.
Analyze Results
Select one or more jobs using the checkboxes and click Analyze to open the combined test analytics view.
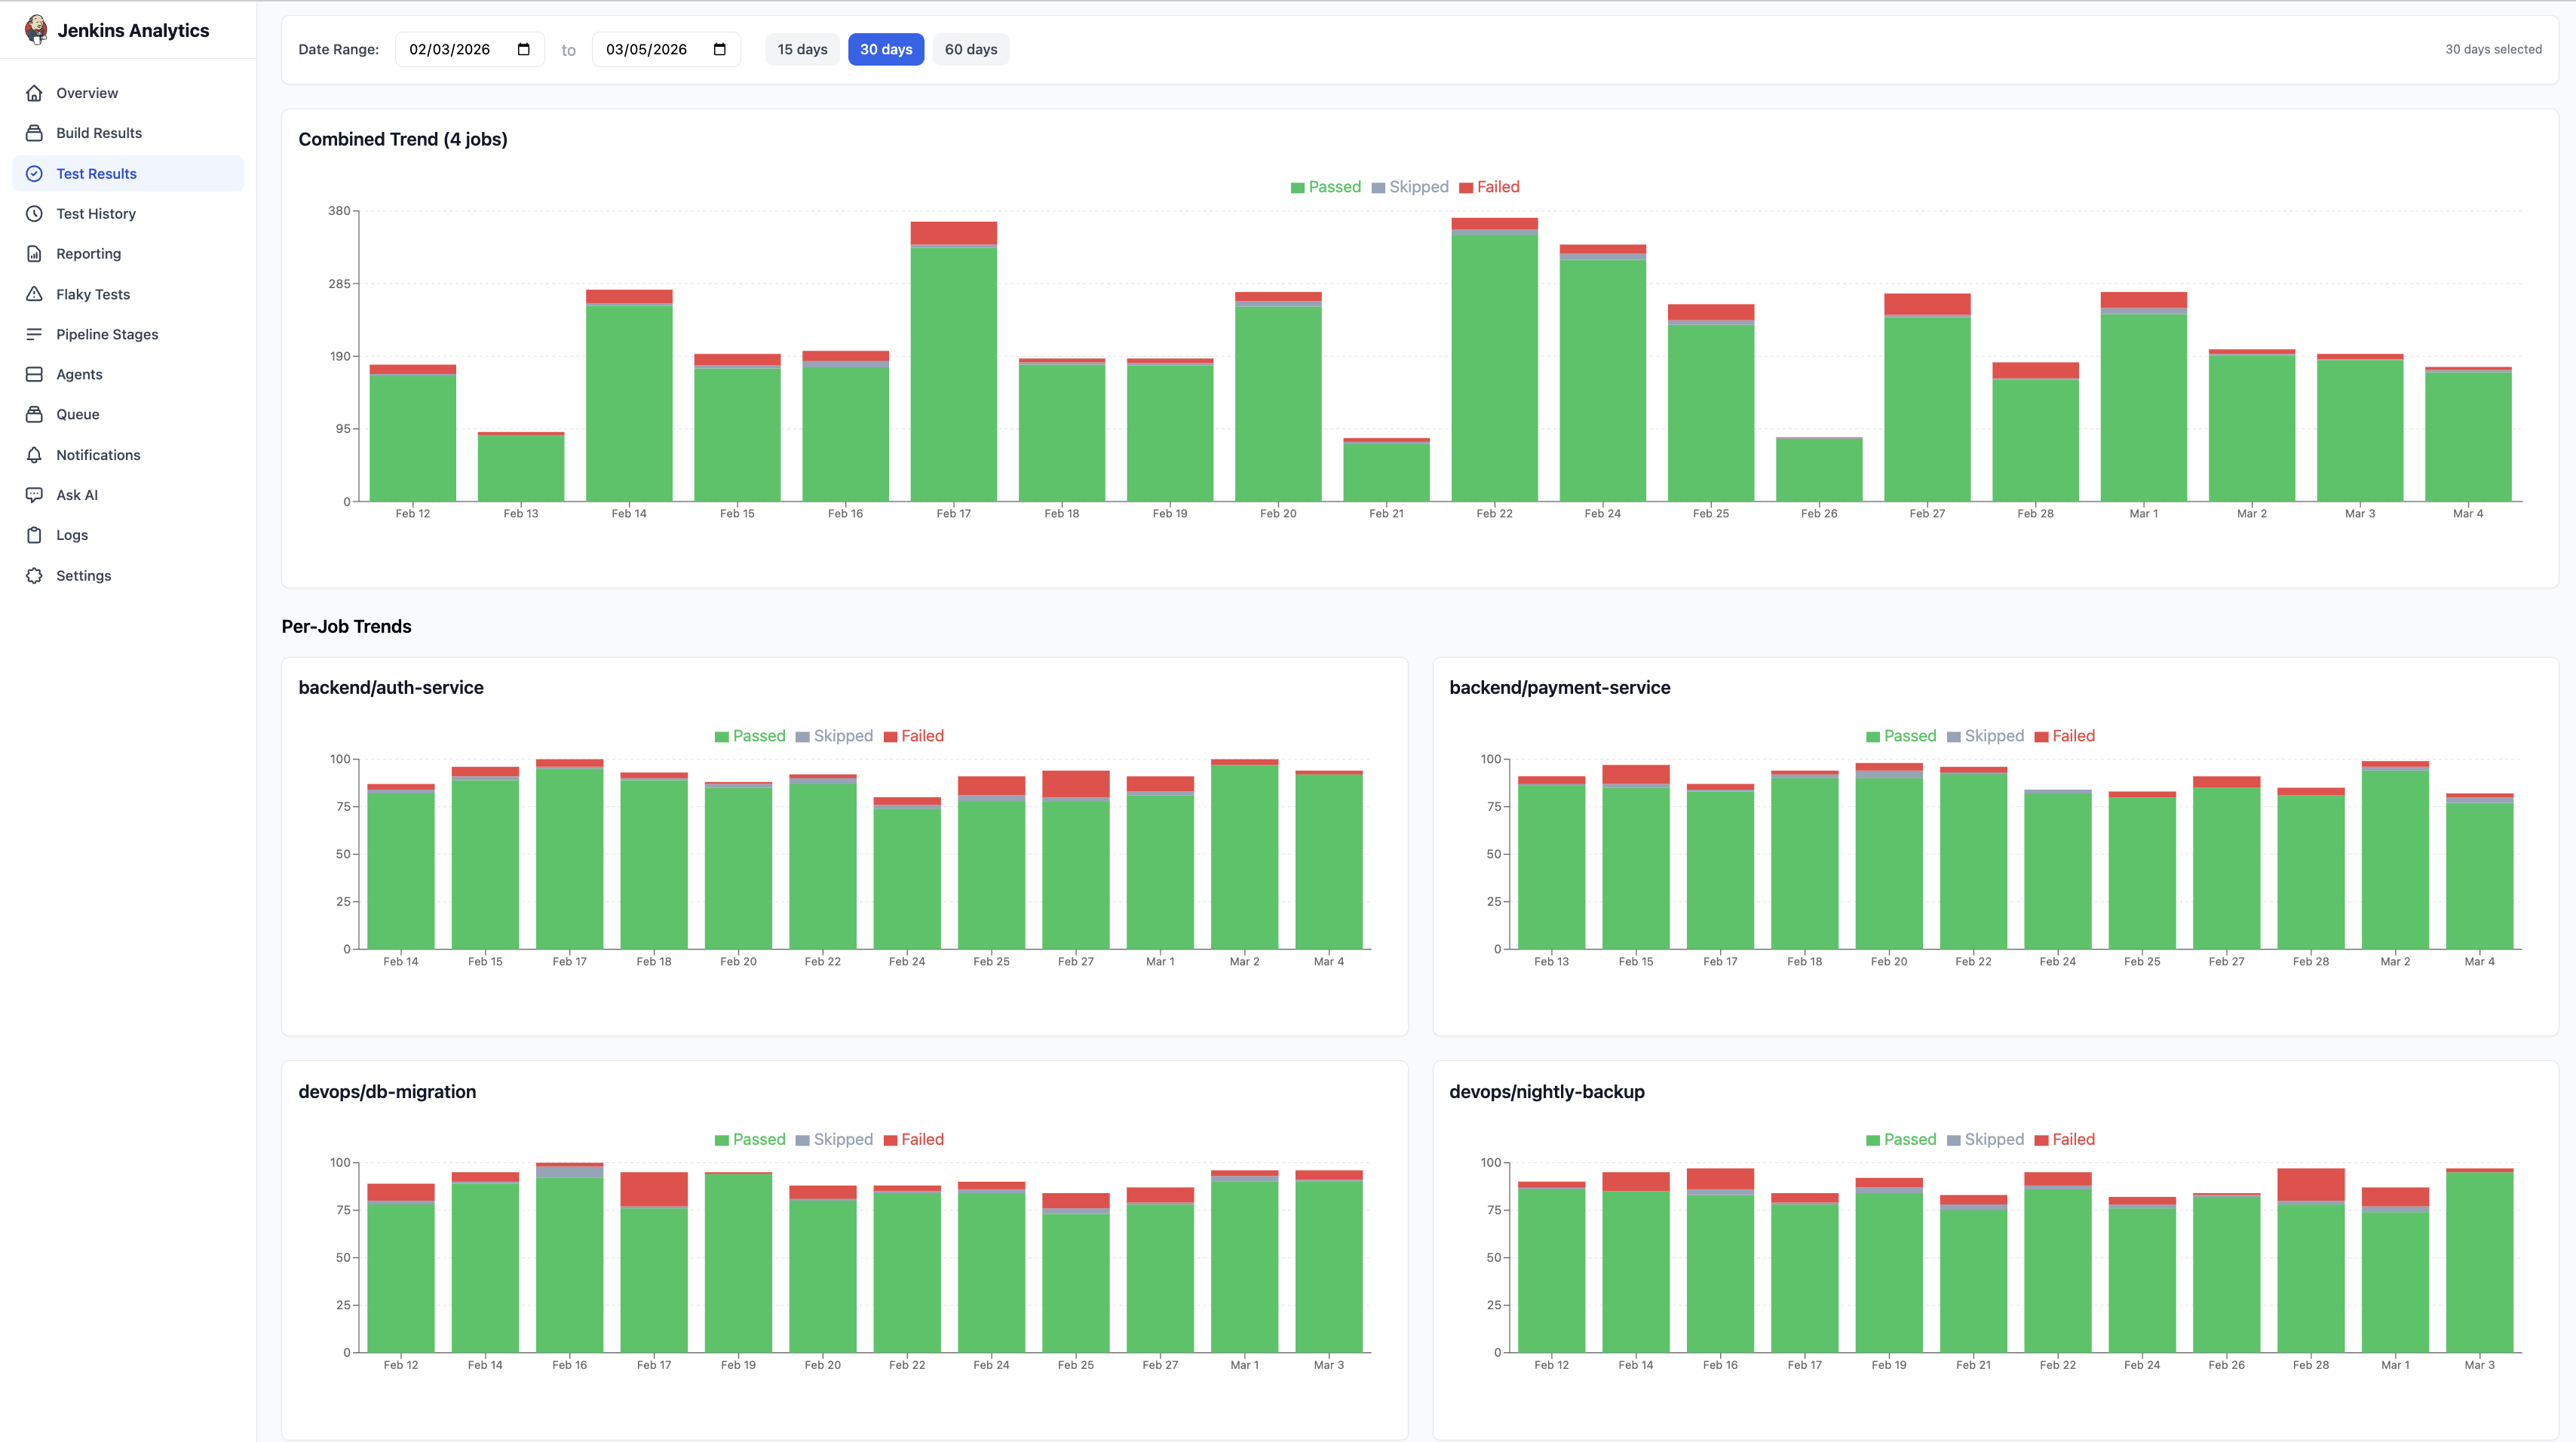
Combined Trend
A stacked area chart showing the total number of Passed, Skipped, and Failed tests per day across all selected jobs. The chart responds to the date range controls at the top (15 / 30 / 60 days or custom range).
Per-Job Trends
Below the combined chart, individual charts appear for each selected job, showing that job's test trend in isolation. Hover over any data point to see the exact counts for that day. This helps identify which job is contributing to test failures.