Agents
Monitor build agent status, reliability, and availability across all connected CI servers.
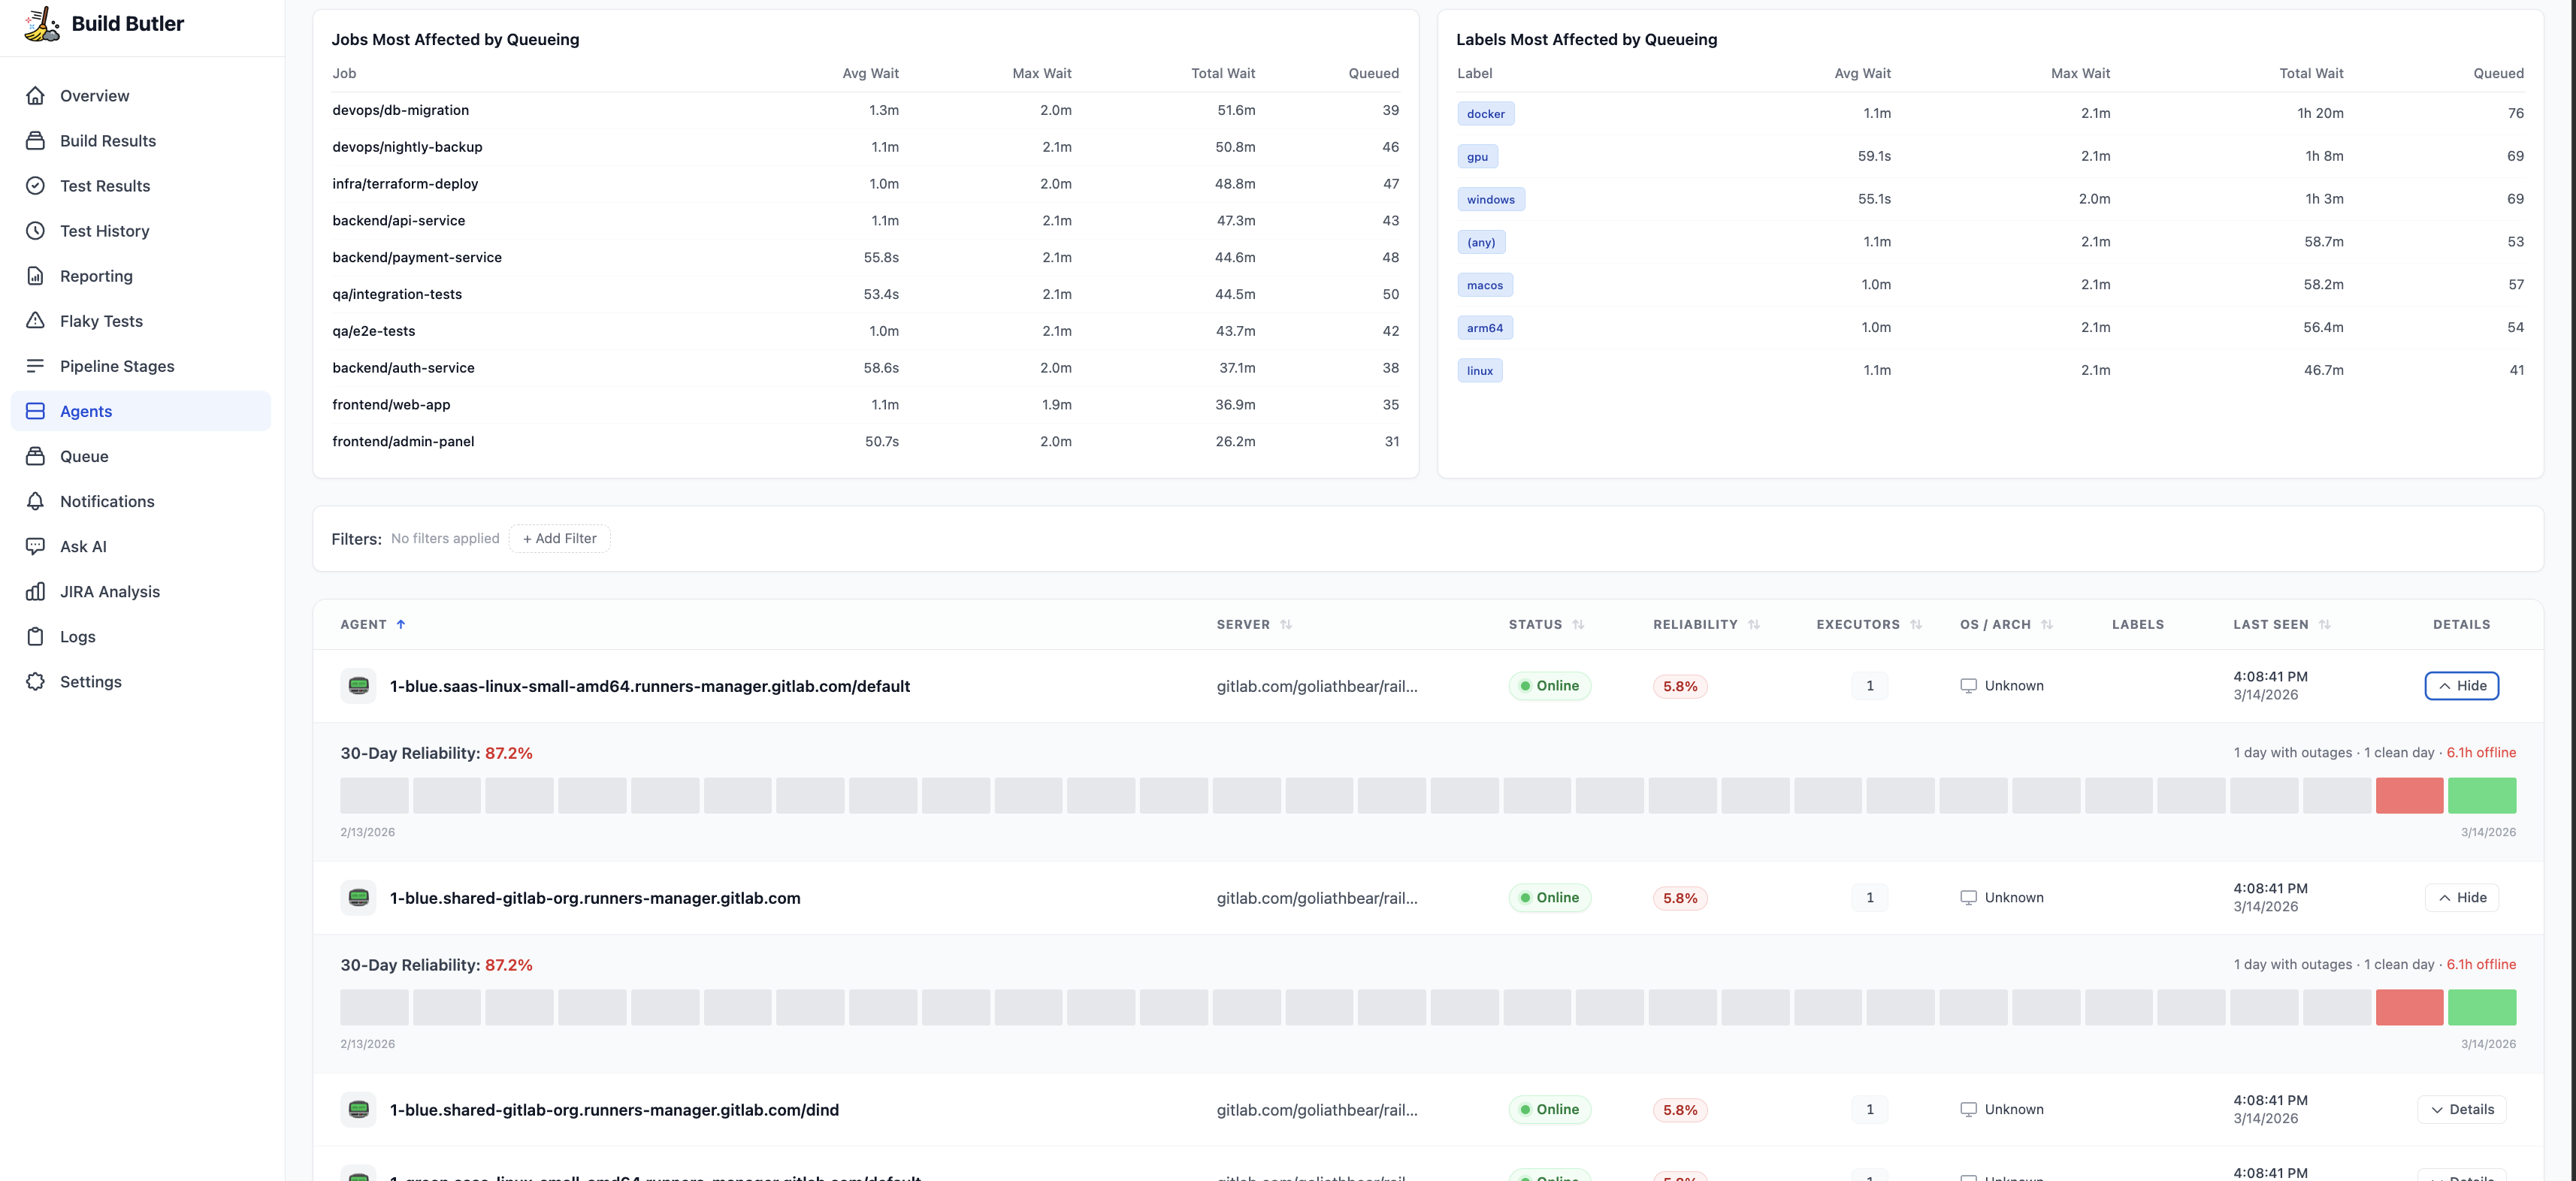
The Agents page shows every build agent across all your connected CI servers with real-time status and historical reliability data.
Agent table
The main table includes the following columns (all sortable):
| Column | Description |
|---|---|
| Agent | Agent name (e.g., agent-001) |
| Server | CI server URL |
| Status | Online or Offline (with colour indicator) |
| Reliability | Uptime percentage over the selected period |
| Executors | Number of executor slots on this agent |
| OS / Arch | Operating system and architecture (e.g., Linux) |
| Labels | Labels assigned to the agent (shown as chips, e.g., baremetal, linux) |
| Last Seen | Timestamp of the last heartbeat from this agent |
| Details | Expand / Hide button for the reliability timeline |
30-Day Reliability
Click Details (or Hide) on any agent row to expand the 30-day reliability view. This shows:
- 30-Day Reliability percentage (e.g., 100%)
- A visual timeline with one block per day — shaded blocks indicate the agent was online that day
- Summary stats:
- Days with outages
- Clean days (no downtime)
- Total hours offline
Use cases
- Capacity planning — see how many executors are available and whether agents are being fully utilised
- Outage investigation — spot agents that went offline and correlate with build failures on the same day
- Label management — verify agents have the correct labels for your pipeline directives
- Multi-server monitoring — view agents from all CI servers in one table instead of checking each CI UI separately
Alerts
Configure Slack notifications to get alerted when an agent goes offline. In the Slack webhook settings, enable the Agent Offline event to receive real-time alerts.