Build Results
View build trends, status breakdowns, and a filterable table of every build across all your CI jobs.
The Build Results page is the primary analytics view in BuildButler. It gives you a comprehensive picture of build health across all connected CI servers.
Page layout
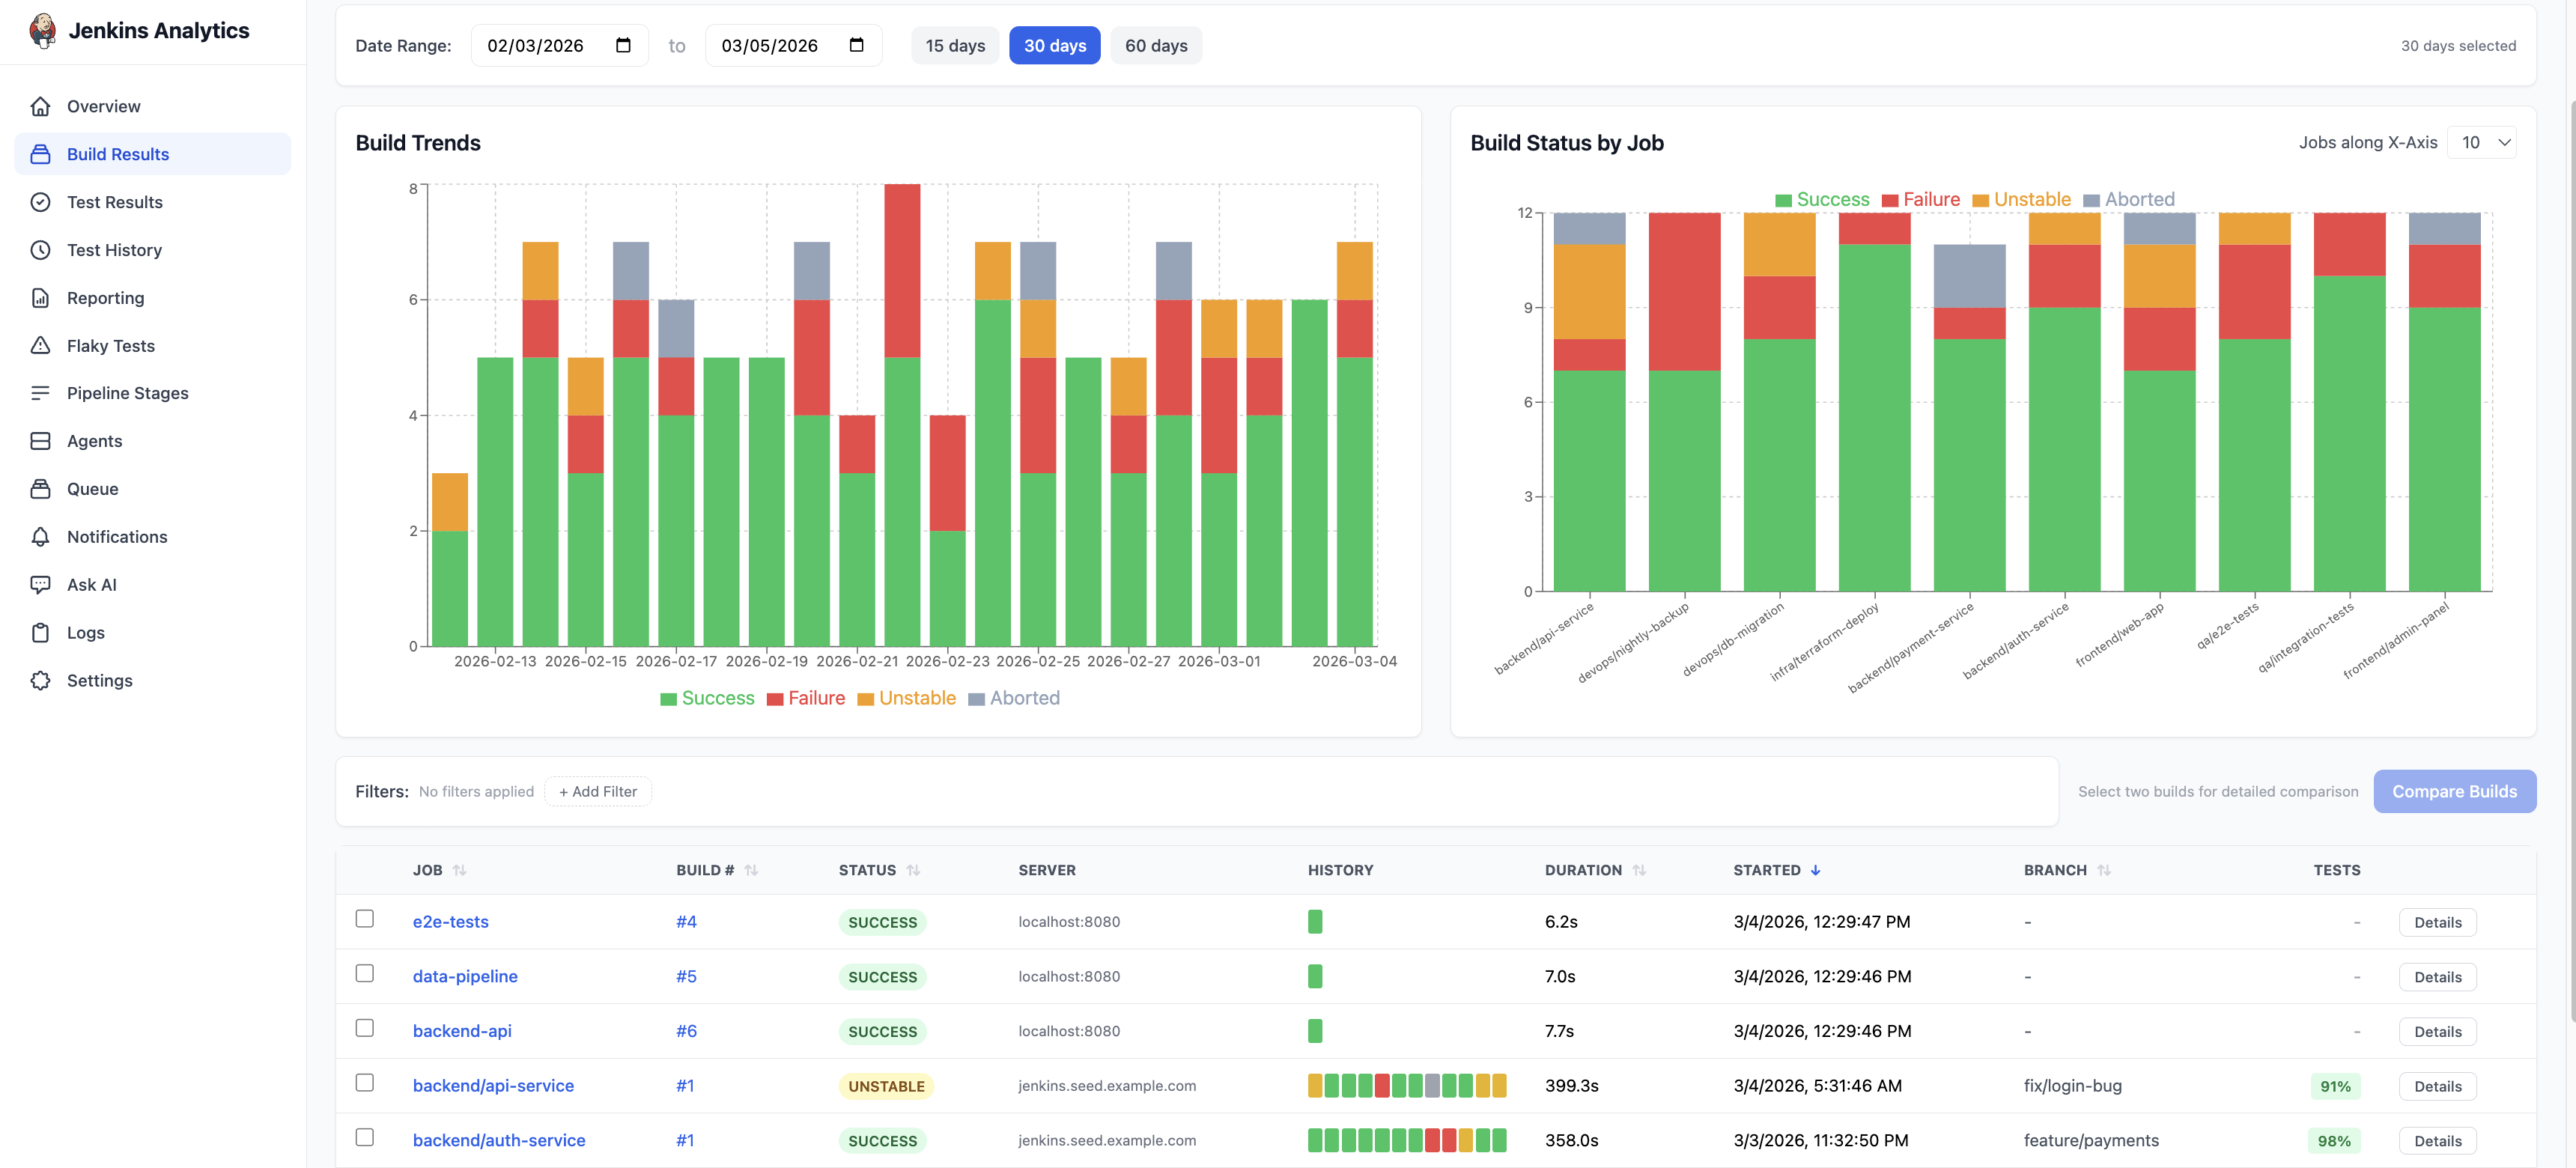
The Build Results page is divided into three sections:
- Charts — Build Trends and Build Status by Job
- Filters — narrow results by job, status, server, or branch
- Build table — every build with sortable columns
Date range
Use the date range controls at the top of the page to set the time window. Quick presets are available for 15 days, 30 days, and 60 days, or pick a custom range using the date pickers.
Build Trends chart
A stacked area chart showing daily build volume by outcome:
- Green — Success
- Red — Failure
- Amber — Unstable
- Gray — Aborted
This chart makes it easy to spot periods of instability or track improvement over time.
Build Status by Job
A stacked bar chart with one bar per job. Each bar shows the proportion of Success, Failure, Unstable, and Aborted builds for that job. Jobs with high failure rates stand out immediately.
Filters
Click + Add Filter to narrow the results. You can filter by:
- Job — specific job name or pattern
- Status — SUCCESS, FAILURE, UNSTABLE, ABORTED
- Server — filter by CI server
- Branch — Git branch name
Multiple filters can be combined. Active filters appear as chips below the filter bar.
Build results table
The table shows every build matching your filters. Columns include:
| Column | Description |
|---|---|
| Job | Job name (clickable — opens job details) |
| Build # | Build number (clickable — opens build details) |
| Status | SUCCESS, FAILURE, UNSTABLE, or ABORTED |
| Server | The CI server that ran the build |
| History | Colour-coded blocks showing recent build history for that job |
| Duration | Wall-clock build time |
| Started | Timestamp when the build started |
| Branch | Git branch (if available) |
| Tests | Test pass rate percentage |
All columns are sortable. Click a column header to sort ascending, click again for descending.
Click Details on any row to open the full build page with console output, test results, pipeline stages, and failure analysis.
Selecting builds for comparison
Use the checkboxes on the left side of each row to select two builds, then click Compare Builds to open the build comparison view.
Usage plan indicator
A banner at the top of the page shows your current usage against your plan limit. Upgrade to Pro or Enterprise for higher build limits.