Test History
Track individual test performance over time — duration trends, pass rates, status timelines, and tags.
The Test History page lets you browse all test cases and drill into the full history of any individual test across all builds.
Test list
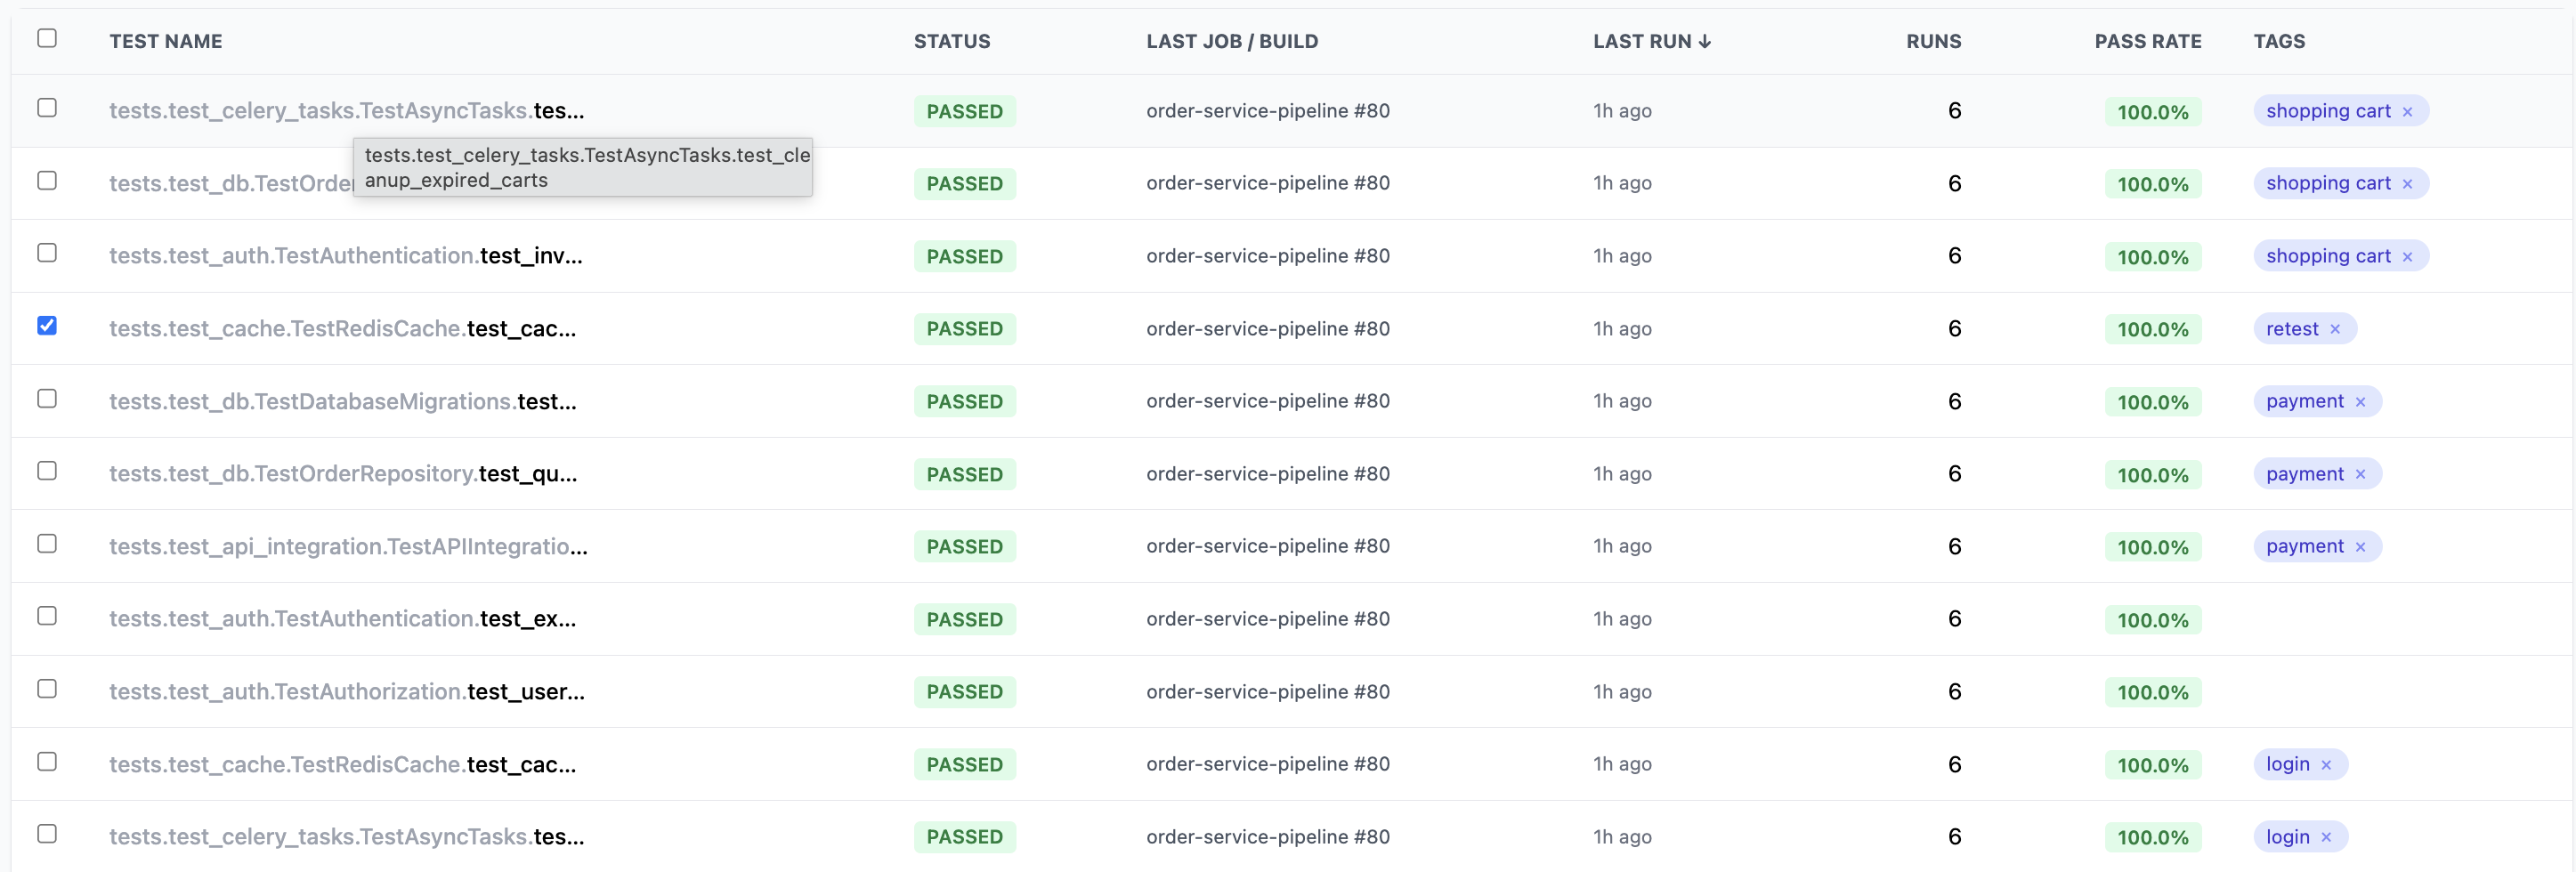
The main view shows every test case with sortable columns:
| Column | Description |
|---|---|
| Test Name | Fully-qualified class and test name (hover for full name) |
| Status | Current status — PASSED, FAILED, SKIPPED |
| Last Job / Build | The most recent job and build number that ran this test |
| Last Run | How long ago the test last executed |
| Runs | Total number of executions |
| Pass Rate | Overall pass rate percentage |
| Tags | Tags applied to this test (removable with x) |
Filters
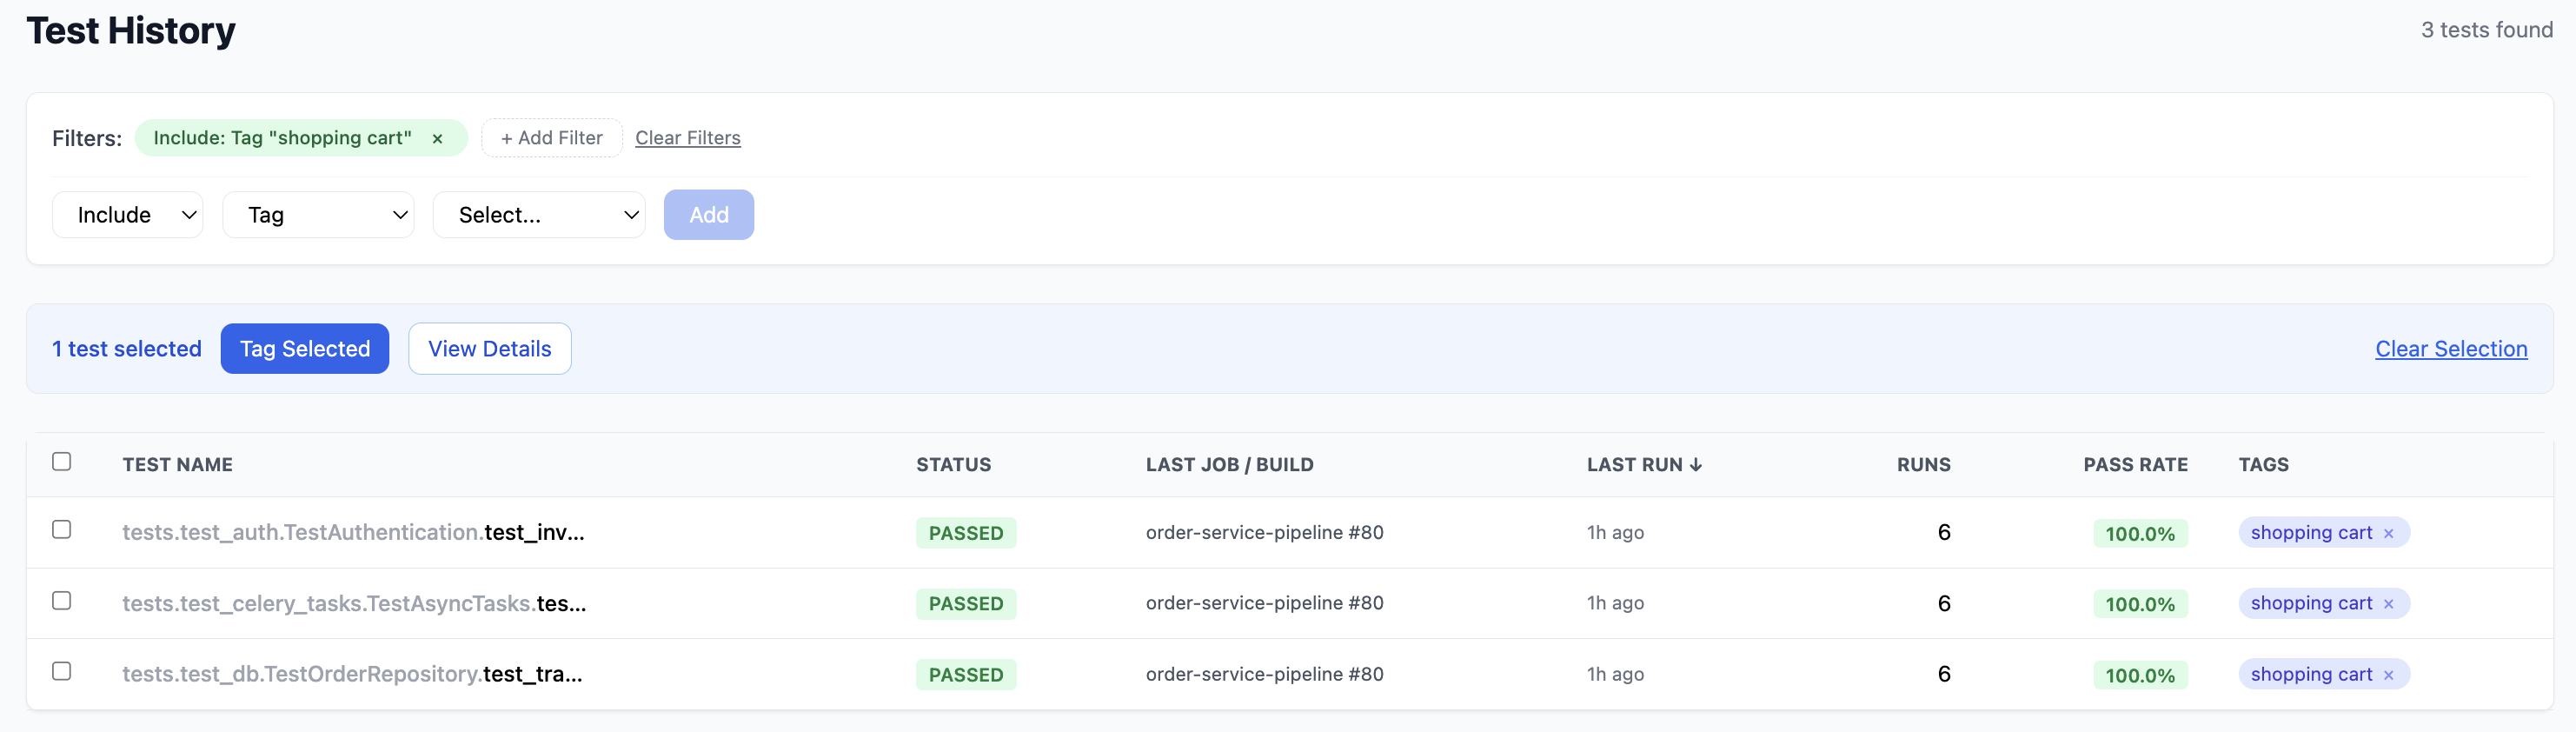
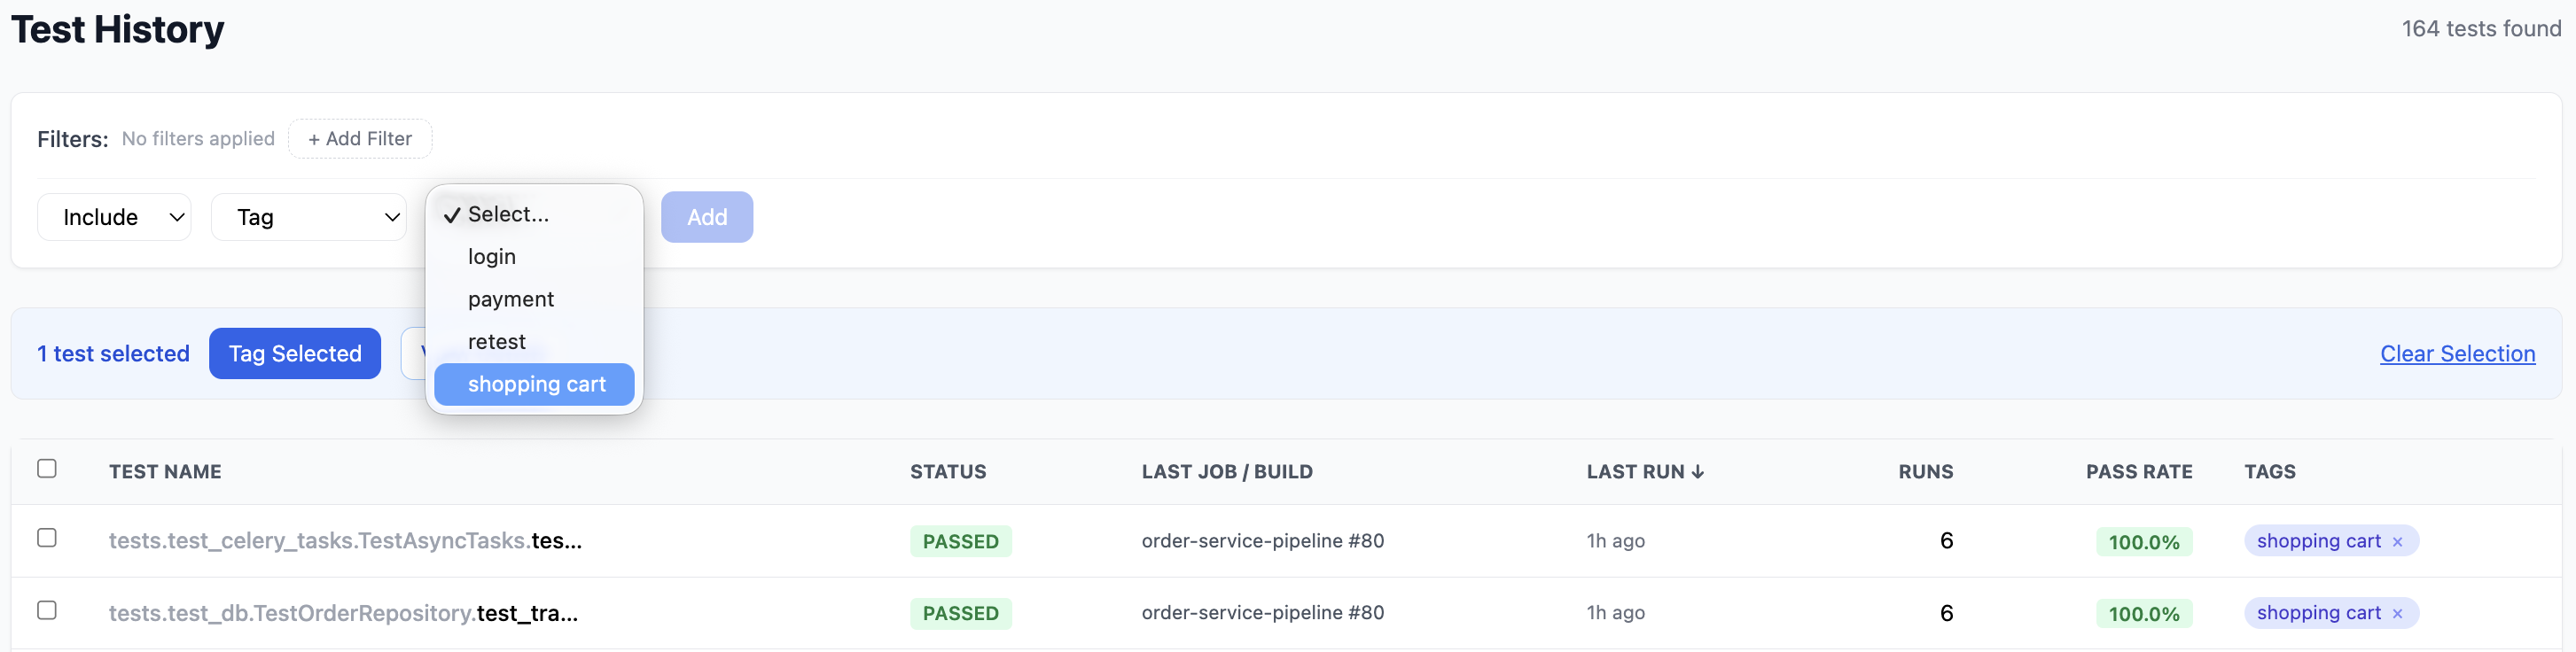
Click + Add Filter to narrow the test list. Filters support:
- Include / Exclude — choose whether to include or exclude matching tests
- Tag — filter by tag name from a dropdown of all existing tags (e.g.
shopping cart,payment,login,retest)
Active filters appear as chips below the filter bar. Click Clear Filters to reset.
Tagging
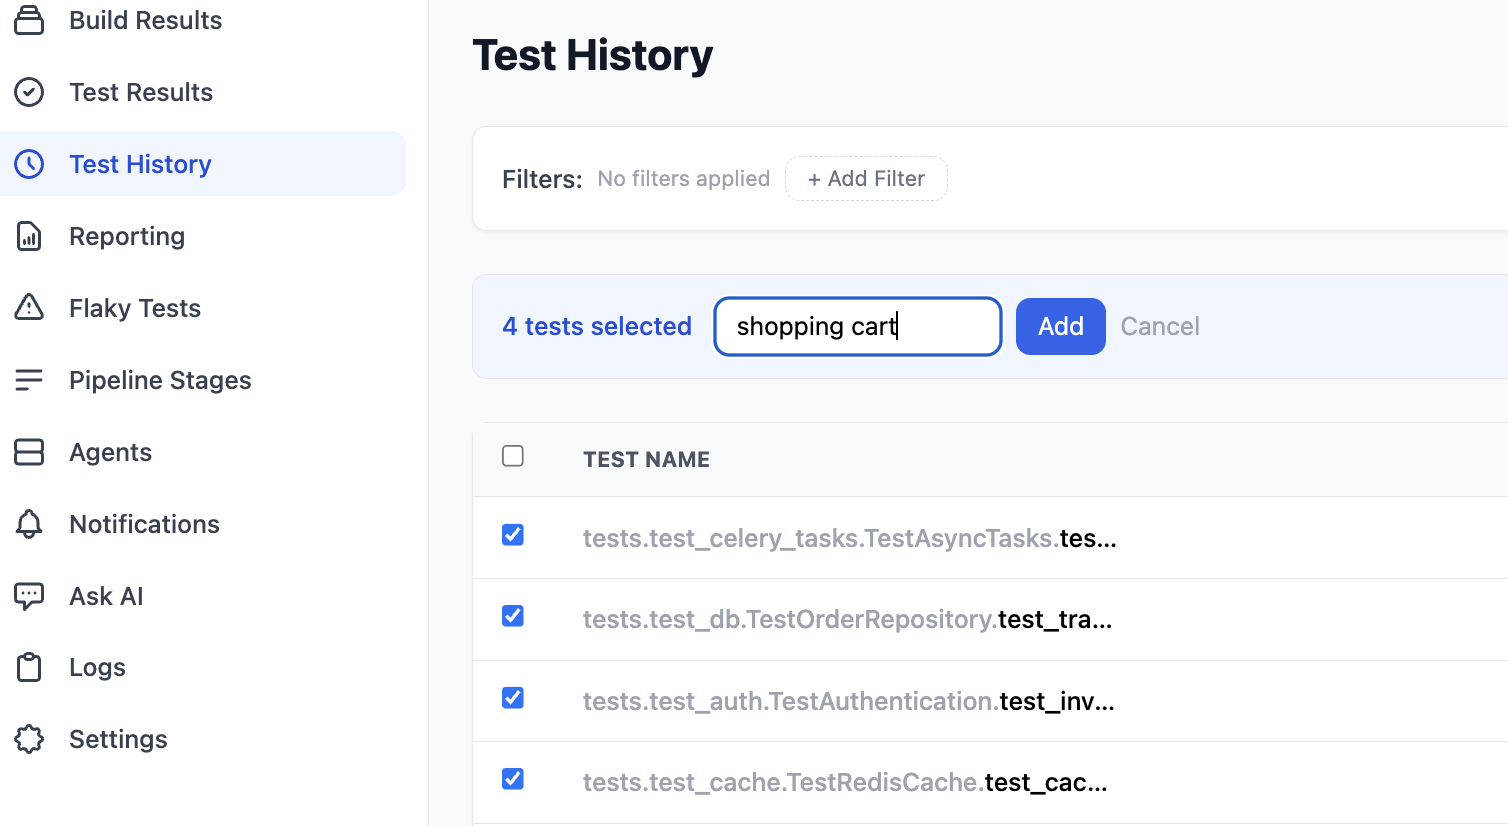
Select one or more tests using the checkboxes, then click Tag Selected to apply a tag. You can also click View Details to open the test detail page for the selected test. Click Clear Selection to deselect all.
Test Details
Click any test name to open its detail page. The header shows the test name, class, current status badge, and key metrics.
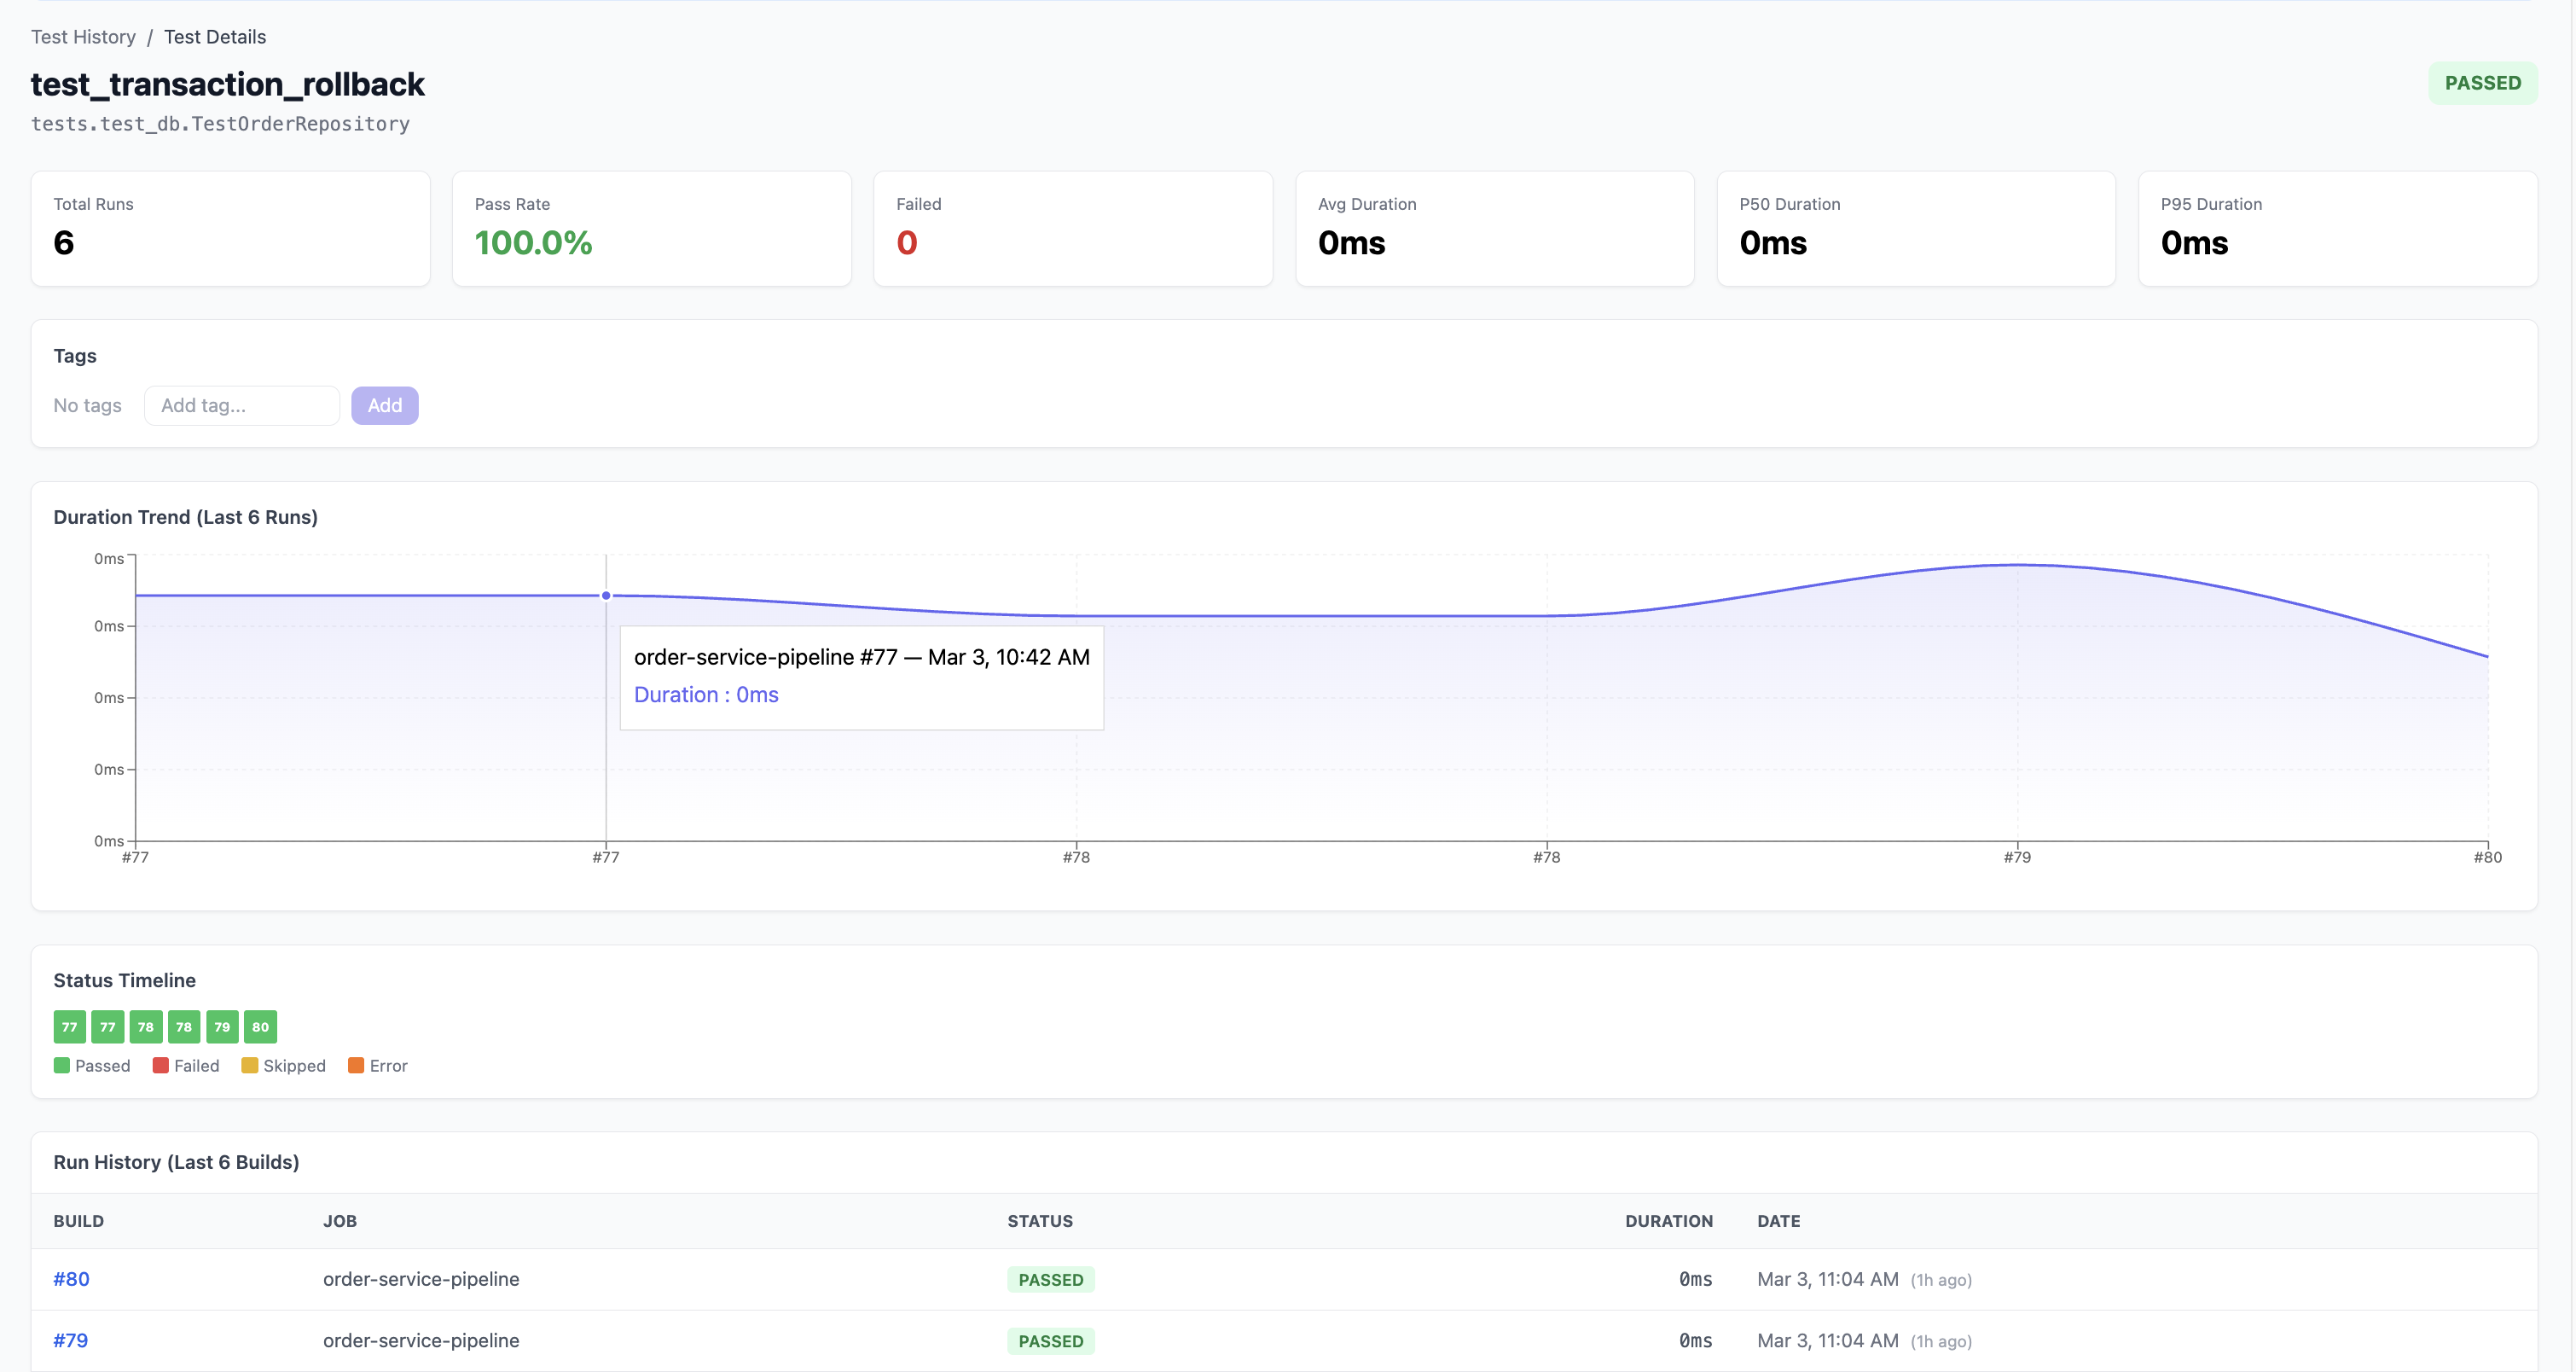
Metric cards
Six metric cards provide a summary of the test's performance:
| Metric | Description |
|---|---|
| Total Runs | How many times this test has been executed |
| Pass Rate | Percentage of runs that passed |
| Failed | Number of failed runs |
| Avg Duration | Average execution time |
| P50 Duration | Median execution time |
| P95 Duration | 95th percentile execution time |
Tags
Tests can be tagged for organisation and tracking. Tags appear as coloured chips below the metric cards. You can:
- Add new tags by typing in the Add tag... input and clicking Add
- Remove tags by clicking the x on an existing tag
Common tags include flaky, slow, critical, and custom labels for feature areas.
Duration Trend
A line chart showing the test's execution duration over the last 6 runs. Hover over any data point to see the exact build number, date, and duration.
This chart helps identify:
- Tests that are getting slower over time
- Duration spikes that correlate with specific builds
- Performance regressions after code changes
Status Timeline
A horizontal row of colour-coded blocks showing the pass/fail history of the test across recent builds:
- Green — Passed
- Red — Failed
- Yellow — Skipped
- Orange — Error
Each block shows the build number. The timeline gives you an instant visual of test stability. Tests with frequent colour changes (alternating green and red) are likely flaky and will also appear on the Flaky Tests page.
Run History
A table showing the last 6 builds for this test with columns for build number, job name, status, duration, and date. Build numbers are clickable links to the Build Details page.