Pipeline Stages
Visualise stage-level execution with scatter plots, duration distributions, and P95 boundaries.
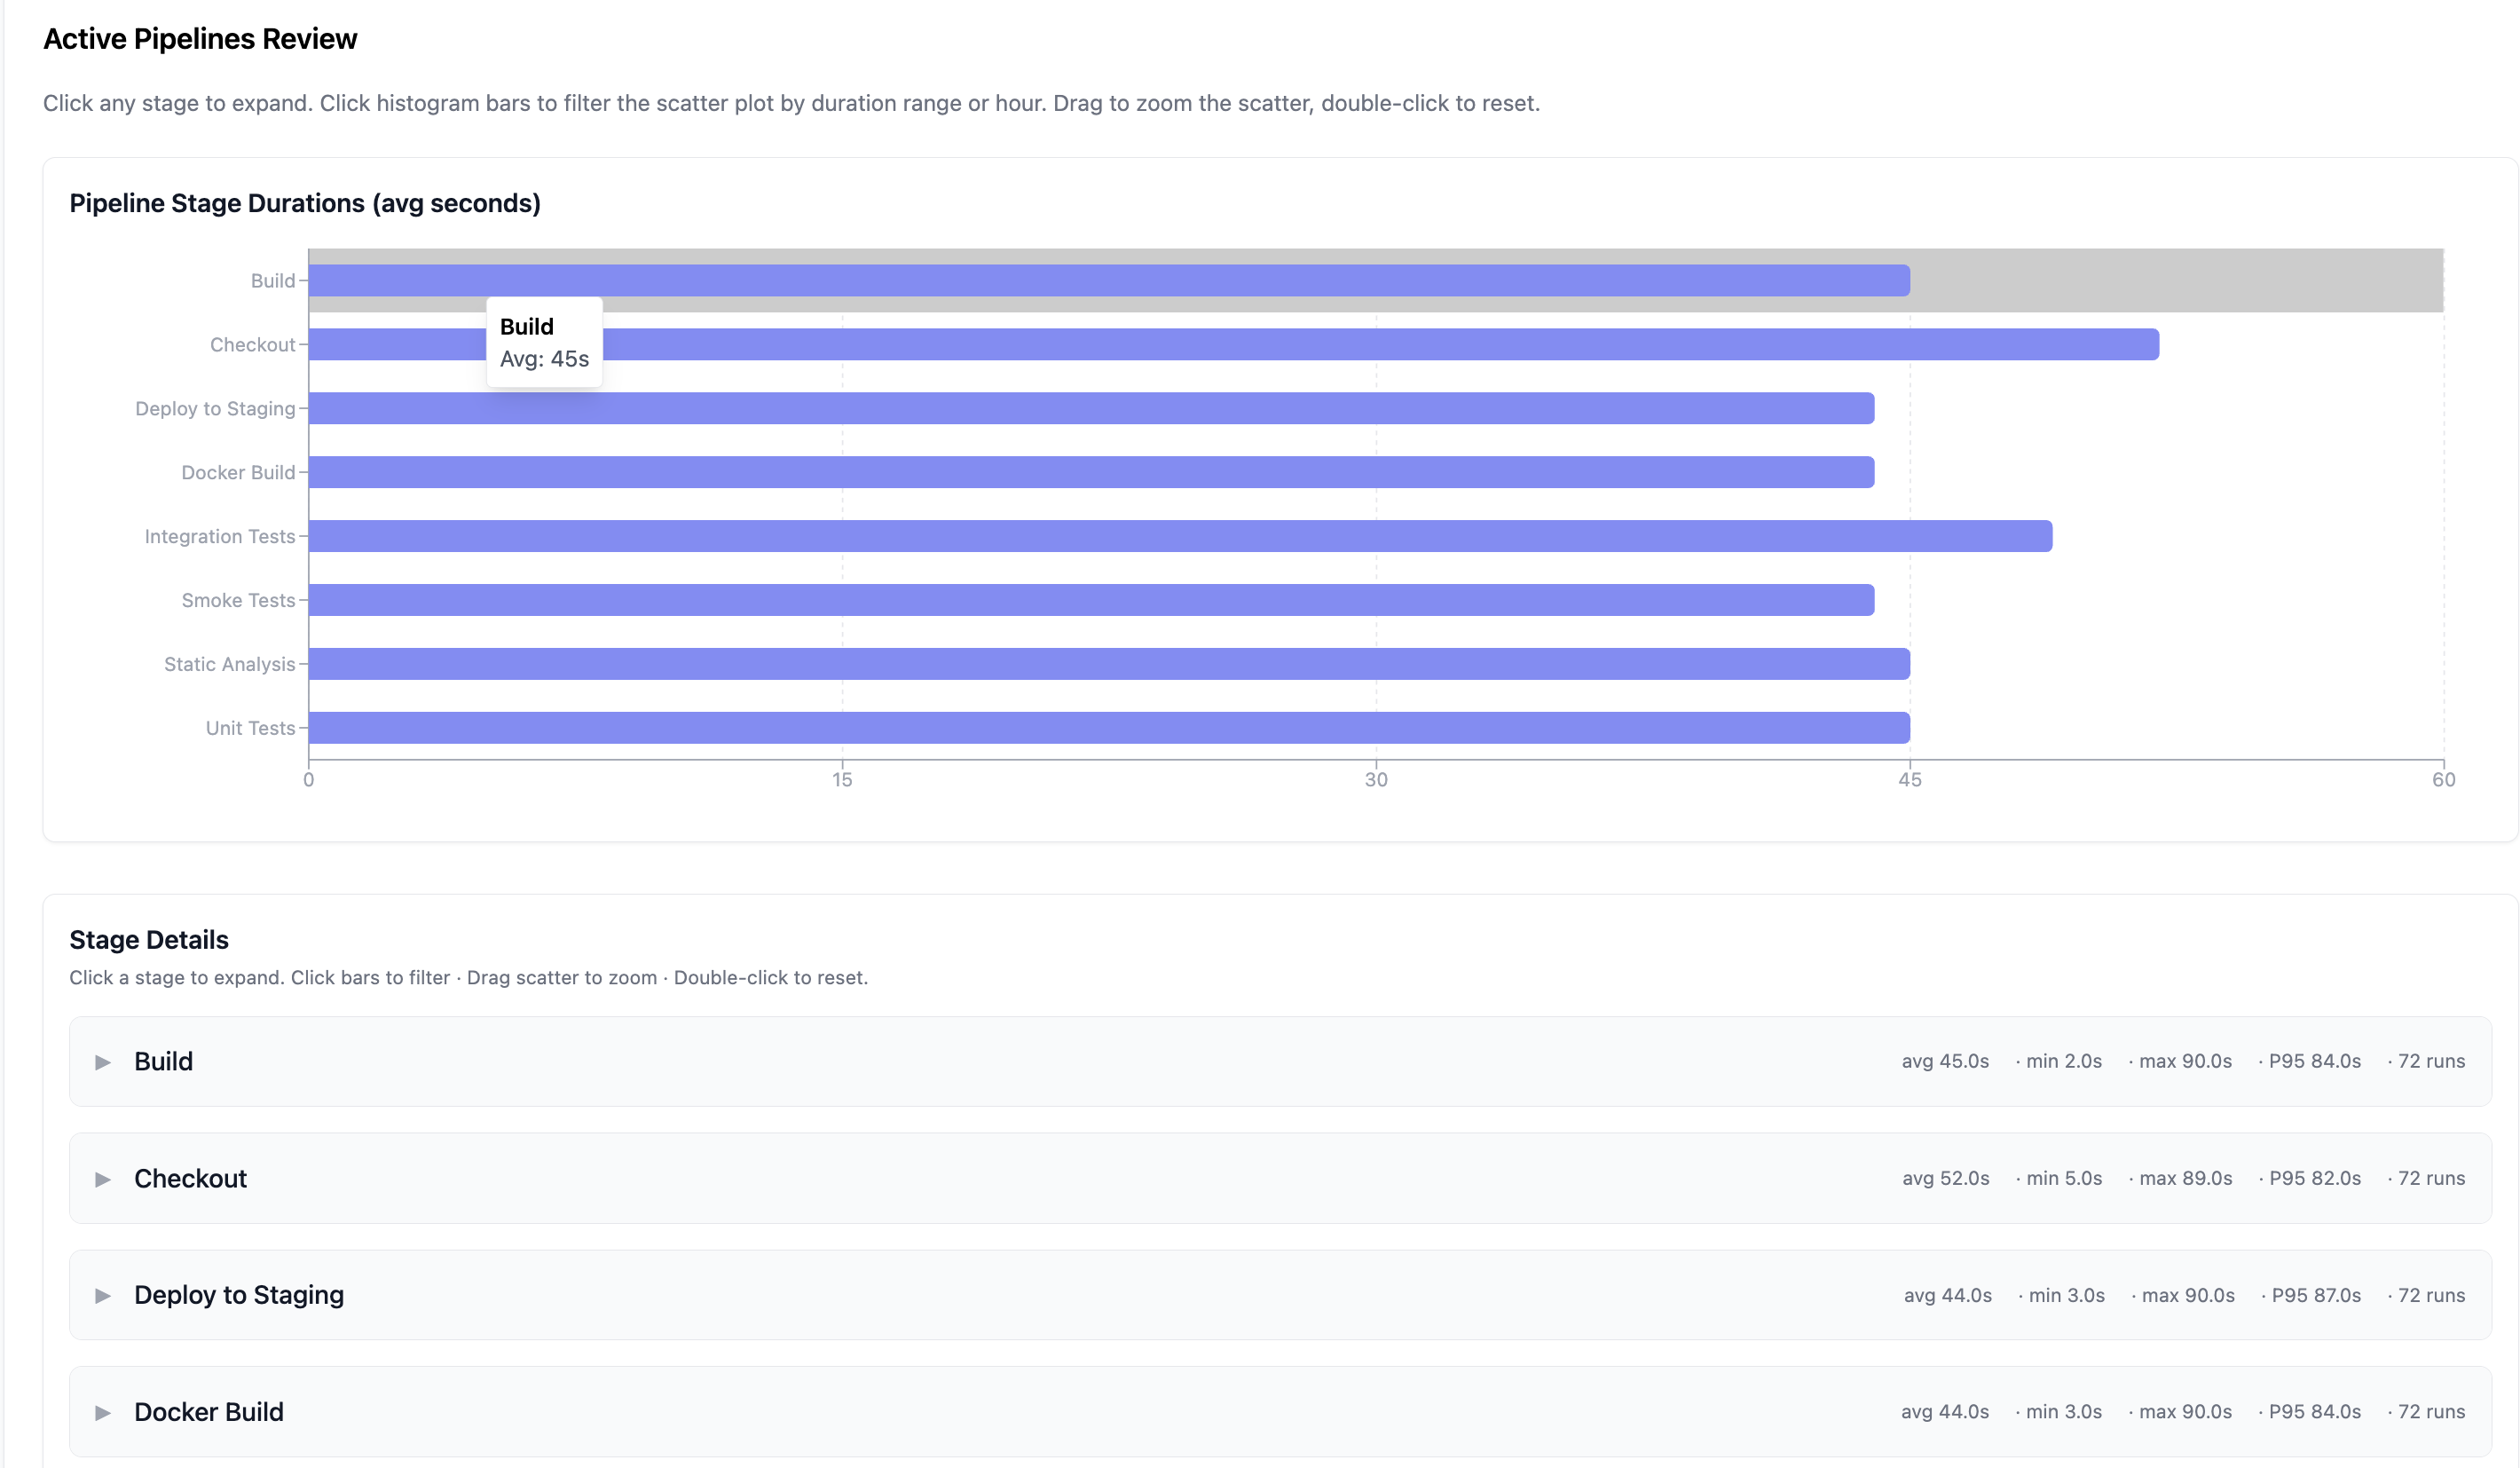
The Pipeline Stages page gives you stage-level visibility into your CI pipeline jobs.
Overview
For each pipeline stage, BuildButler collects:
- Execution count
- Average duration
- P95 duration
Click any stage to expand its detail view.
Stage Details
Each expanded stage shows summary metrics at the top: avg, min, max, P95 duration, and total runs.
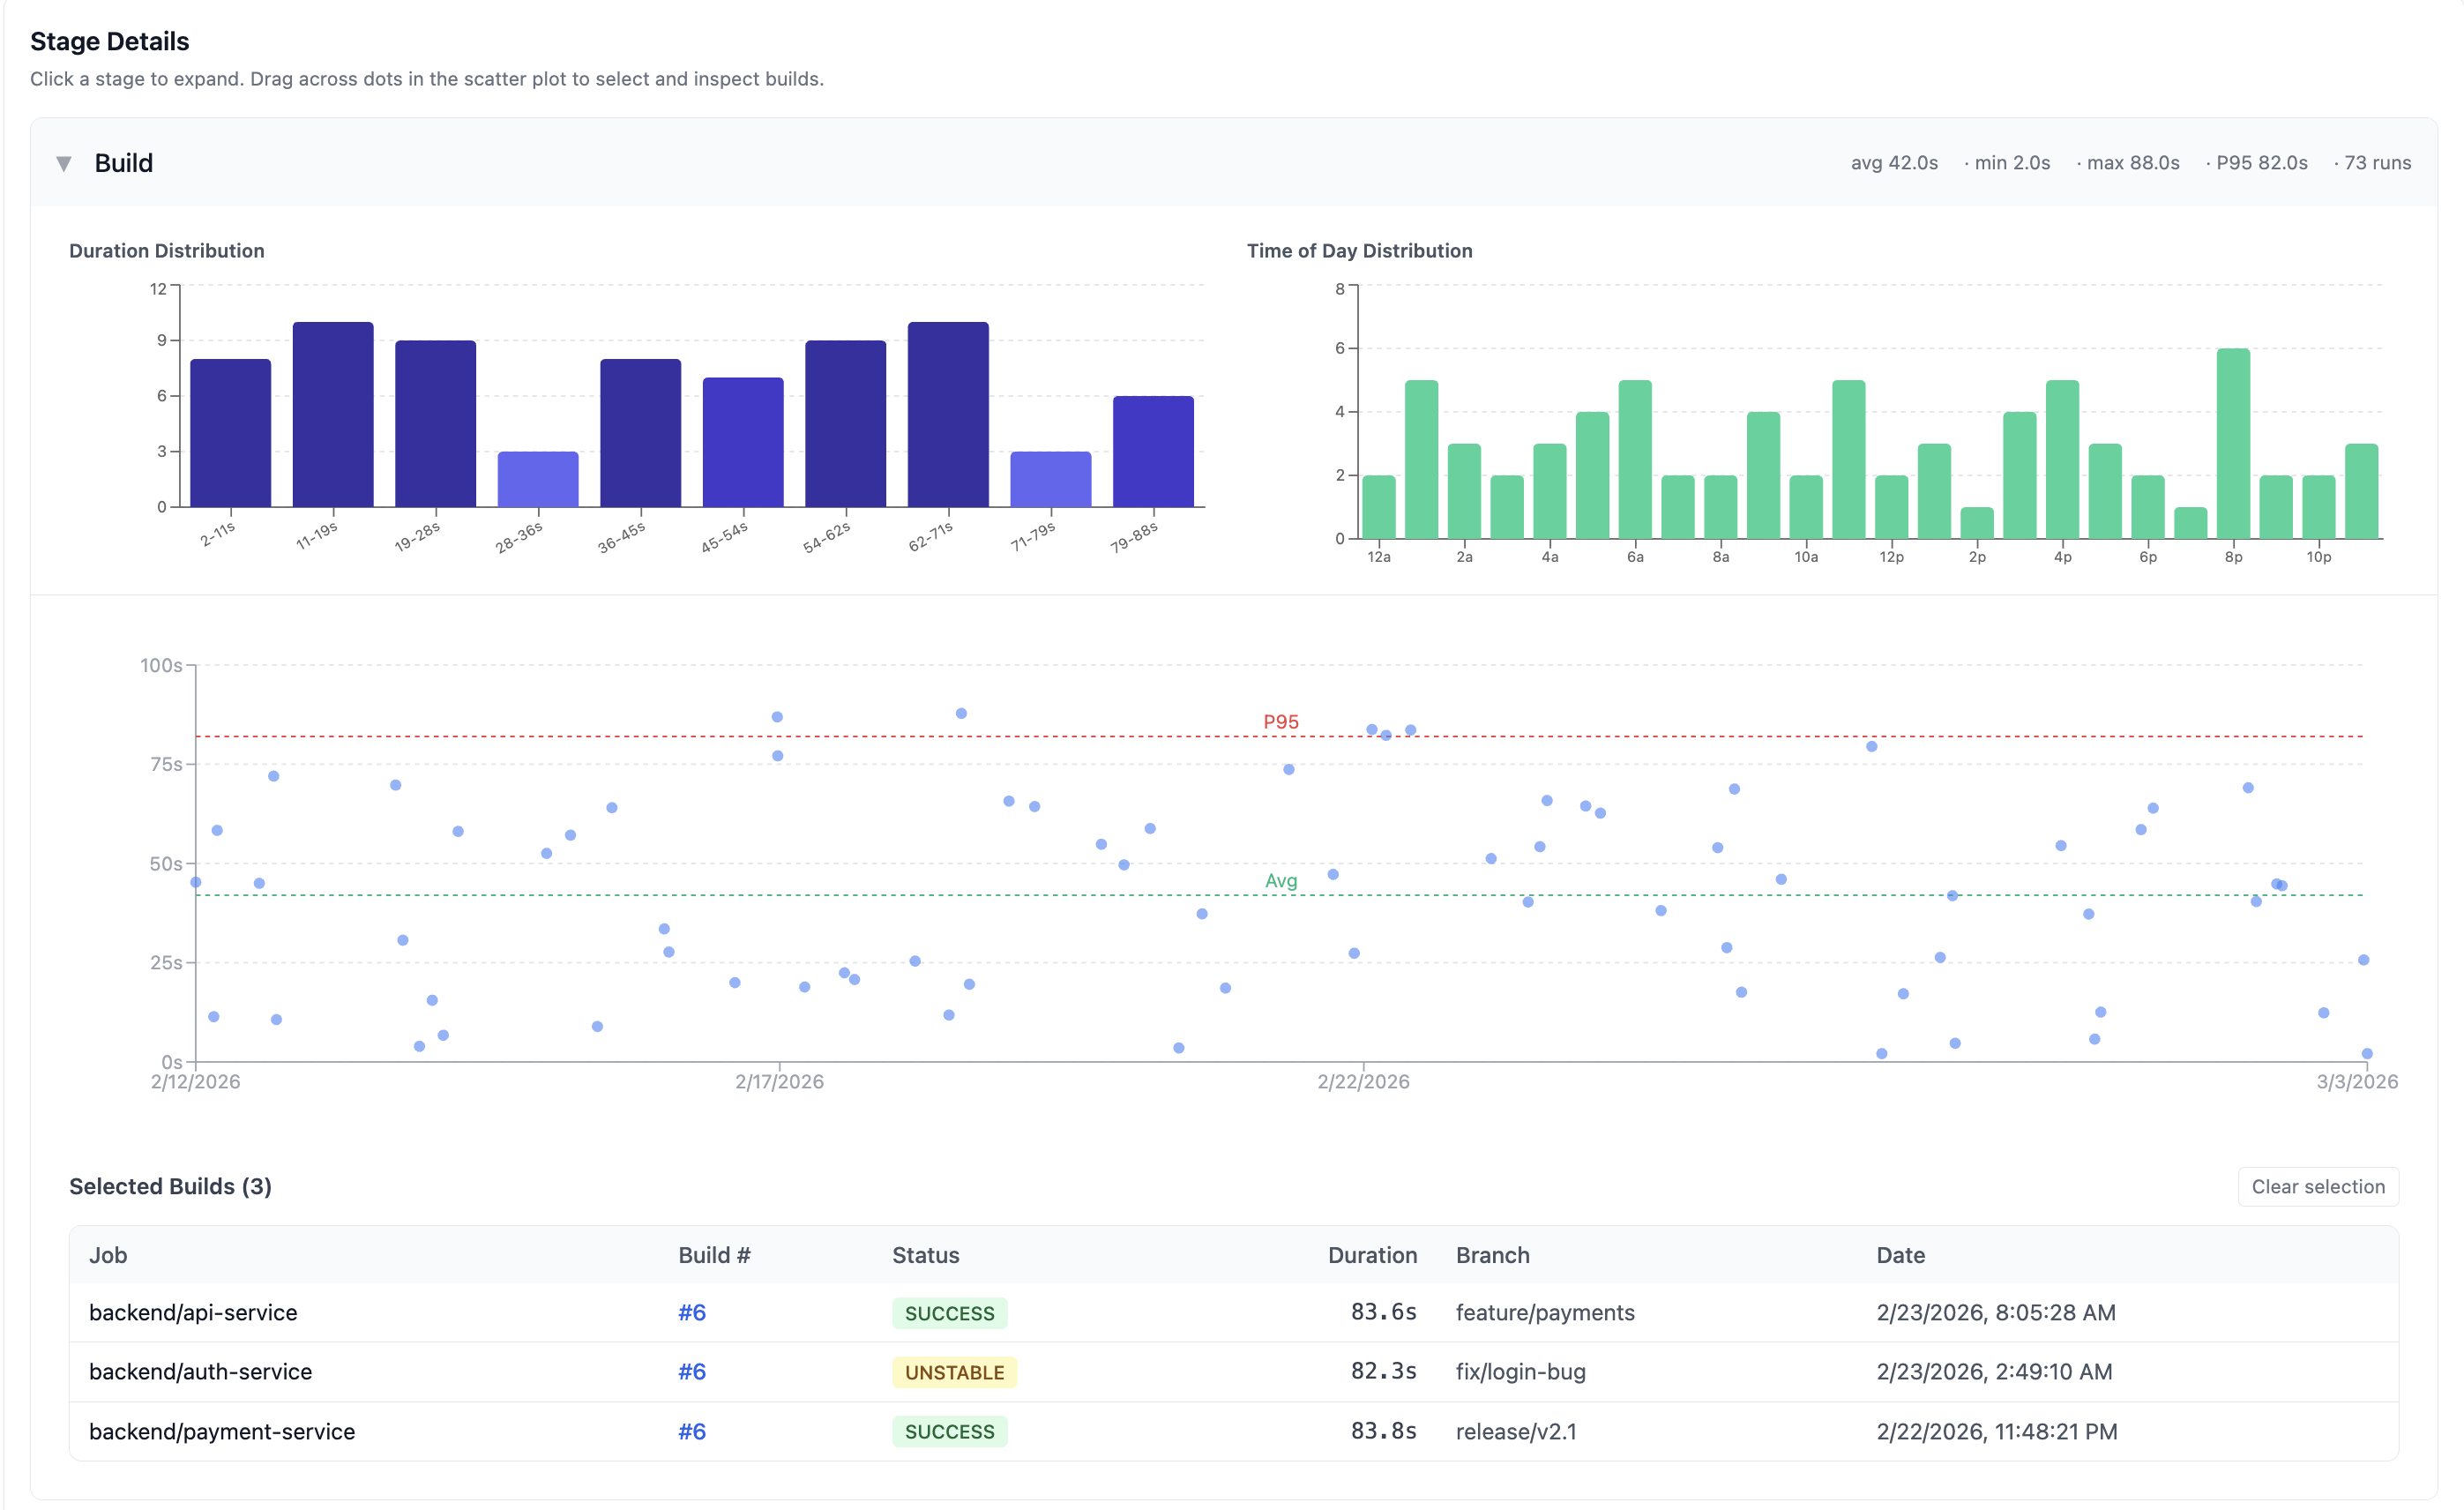
Duration Distribution
A histogram showing how stage execution times are distributed across duration buckets. This helps identify whether a stage has consistent performance or a wide spread of execution times.
Time of Day Distribution
A bar chart showing when builds run throughout the day. This reveals peak build times and helps identify whether time-of-day correlates with slower builds (e.g. resource contention during business hours).
Scatter plot
A scatter plot where each dot represents a single build execution of that stage. The chart highlights:
- Avg boundary — a green dashed line showing the average duration
- P95 boundary — a red dashed line showing the 95th percentile duration threshold
Hover over any dot to see build details including job name, build number, duration, and date.
Selecting builds
Drag across dots on the scatter plot to select multiple builds. Selected builds appear in a table below the chart:
| Column | Description |
|---|---|
| Job | Job name |
| Build # | Build number (clickable) |
| Status | SUCCESS, FAILURE, UNSTABLE, etc. |
| Duration | Stage execution time |
| Branch | Git branch |
| Date | When the build ran |
Click Clear selection to deselect all builds.
Identifying bottlenecks
Use the Pipeline Stages view to:
- Find slow stages — stages with high average or P95 durations are pipeline bottlenecks
- Spot outliers — dots far above the P95 line indicate intermittent slowdowns (resource contention, network issues, etc.)
- Compare across jobs — if the same stage (e.g., "Docker Build") is slow across multiple jobs, the issue is likely infrastructure-level
- Track improvements — after optimising a stage, check if the scatter plot tightens around a lower duration